DevOps
Tracing + Profiling in Sentry: From “What’s Slow” to “Why” (2026, Cloud)
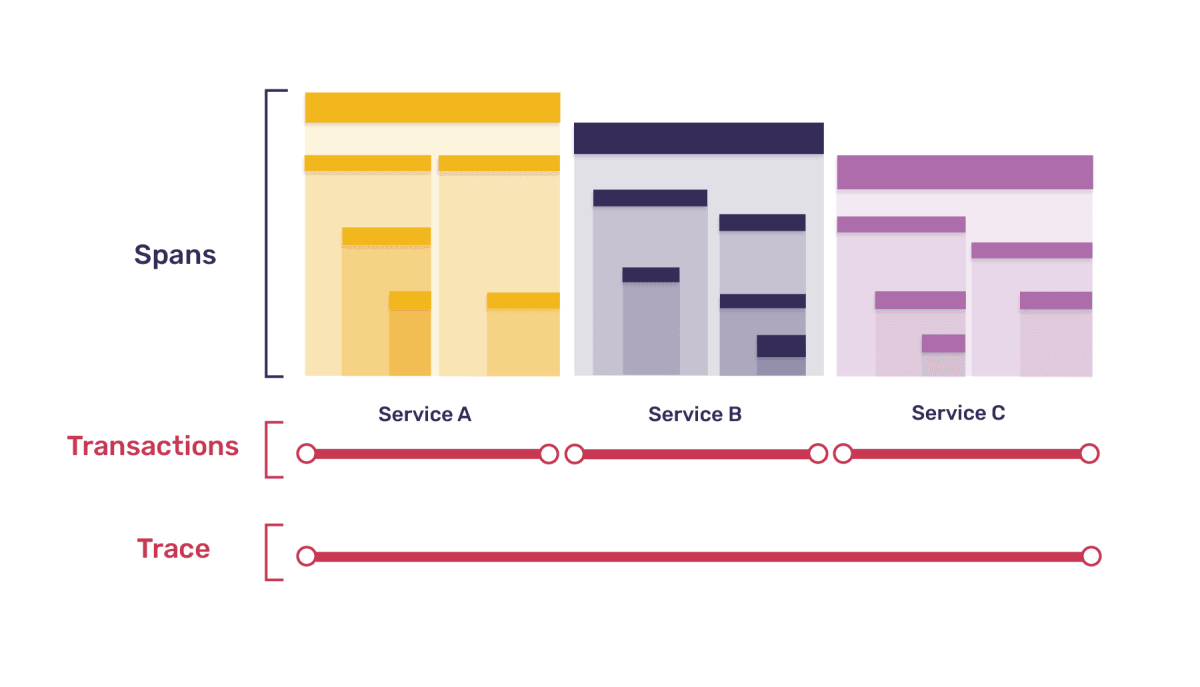
Tracing tells you what is slow and where time is spent (waterfall, spans: DB, HTTP, queues, etc.).
Profiling tells you why it’s slow (CPU hotspots via flame graph / call stacks).
1) Prerequisite: enable Tracing first
Profiling is built on top of tracing, so no tracing = no useful profiling.
Also note the “fork”:
-
Transaction-based profiling:
profilesSampleRate/profiles_sample_rate -
Continuous/UI profiling:
profile_session_sample_rate
They’re mutually exclusive inside one service/app — pick one.
For a classic “open a slow request → see its flame graph” workflow, you want transaction-based profiling.
2) Frontend (React / Next.js)
Enable tracing (Next.js)
Configure performance monitoring (tracing) in your Next.js SDK setup.
Enable profiling (Next.js)
You can profile:
-
Browser (user sessions / page work)
-
Node (SSR / API routes running on Node)
Minimal idea (conceptually): tracesSampleRate + profilesSampleRate in Sentry.init() for the relevant runtime(s). Remember: profilesSampleRate is relative to tracesSampleRate (effective profiled rate ≈ tracesSampleRate * profilesSampleRate).
3) Backend (PHP / Symfony)
Enable tracing (Symfony)
Set traces_sample_rate (or a sampler) to capture transactions/spans.
Enable profiling (Symfony)
Set profiles_sample_rate (transaction-based profiling). It’s applied relative to tracing sampling (multiplication logic: profiling only happens for traced transactions).
Profiler note (PHP)
PHP profiling uses a sampling profiler PHP extension (Sentry docs reference Excimer).
4) How to use Sentry (simple workflow)
4.1 Find traces (what/where is slow)
Main entry (backend):
-
Insights → Backend → at the bottom you’ll see a transactions table (this can include HTTP requests, CLI commands, jobs/queues, etc.).
-
In that table, you can sort/filter by metrics (p95/p99, avg, count, etc.).
-
Click a transaction row → Transaction Summary (an aggregated page for that “group” of transactions).
4.2 Find profiles (why it’s slow)
-
In Transaction Summary, you’ll usually care about:
-
Suspect Functions
-
or you can open a specific event/instance from the list to drill into a single occurrence.
-
-
If you want a specific profile (flame graph) — pick a specific event/instance → you’ll land on the single-event page with the Waterfall, and if that instance was profiled, you’ll also see a Profiles tab/button.
-
The Profiles tab appears only if that specific instance was actually profiled (sampling).
-
In the Profiles view, select one of the profiled events to open the flame graph / frame graph for that event.
-
Alternative entry (if you already have a Trace ID)
-
Explore → Traces → paste the Trace ID (or filter by endpoint) → open the trace → go to the specific transaction event → then open the profile (if sampled).
5) Common gotchas (so you don’t think it’s “broken”)
-
You won’t see profiles if sampling is too low: profiles appear only for sampled transactions.
-
Profiling rate is effectively tracing_rate × profiling_rate (relative sampling).
-
Don’t mix
profiles_sample_ratewithprofile_session_sample_ratein the same service.
Quick doc links
- Next.js guide: https://docs.sentry.io/platforms/javascript/guides/nextjs/
- Next.js profiling overview: https://docs.sentry.io/platforms/javascript/guides/nextjs/profiling/
- Next.js browser profiling: https://docs.sentry.io/platforms/javascript/guides/nextjs/profiling/browser/
- Next.js node profiling: https://docs.sentry.io/platforms/javascript/guides/nextjs/profiling/node/
- Symfony tracing: https://docs.sentry.io/platforms/php/guides/symfony/tracing/
- Symfony profiling: https://docs.sentry.io/platforms/php/guides/symfony/profiling/
- Profiling (product overview): https://docs.sentry.io/product/explore/profiling/